
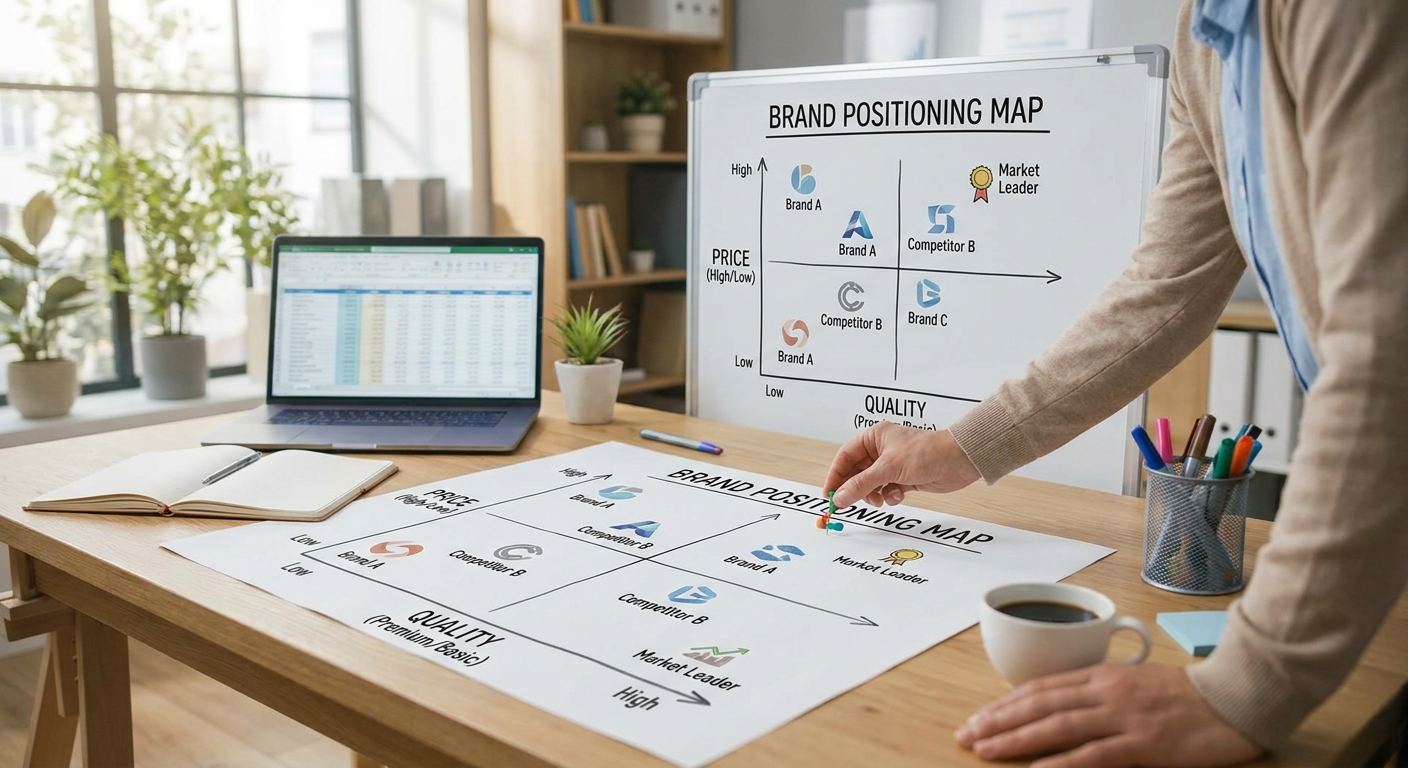
TL;DR: To build a brand positioning map for your category in 2026, pull 8-12 direct competitors, pick two axes that map to real purchase drivers (price vs. formulation, for example, not vague terms like "innovative"), plot pricing and positioning data from public sources, then mark where the white space sits. Brands that skip competitor research and guess at axes end up with maps that look busy but say nothing — verdict: do the research first, draw second. This is a working document, not a deck slide, and it should get revised every two quarters as competitors move.
Why this matters
Most brands think they know where they sit against competitors. Most are wrong, because they're going off gut feel from browsing Instagram instead of structured data on pricing, claims, and channel presence. A positioning map forces you to write down what's actually true — SKU prices, ingredient claims, review counts, ad spend visibility — and that discipline alone catches blind spots before a campaign launch, not after.
The map also becomes the reference point every creative brief, ad concept, and packaging decision gets checked against. Without it, a brand's messaging drifts sideways every quarter as different stakeholders push their own read of the market. With it, competitor analysis turns into a repeatable process instead of a one-off slide nobody revisits.
What you'll need
- A list of 8-12 direct and adjacent competitors in your category, not just the two you think about daily
- Public pricing data for each competitor's core SKU (menu price, subscription price, or per-unit price)
- 20-30 recent customer reviews per competitor, pulled from retail sites or Trustpilot, for language patterns
- Screenshots or notes on each competitor's last 90 days of paid social creative, if visible
- A shared doc or whiteboard tool (Figma, Miro, or even a spreadsheet with an X/Y scatter chart)
- 3-4 hours of uninterrupted time — this isn't a 45-minute exercise if you want it to hold up
The steps
1. Build the competitor set before you build anything else
List every brand a customer would realistically compare you against at the point of purchase, including at least two brands outside your immediate price tier. Skipping this step is the single biggest reason positioning maps end up wrong — teams anchor on the three competitors they're emotionally fixated on and miss the six others actually taking share.
Pull this list from category pages on Amazon, Google Shopping results for your top keyword, and retail shelf sets if you're in physical retail. Aim for 8-12 names minimum in 2026's crowded DTC landscape — fewer than that and your map will look sparse and unconvincing to stakeholders.
Common mistake: limiting the set to brands at your exact price point. Positioning is relative to the whole category, not just your tier.
2. Choose two axes tied to actual purchase drivers
Pick axes customers use to decide, not axes marketers use to describe themselves. "Price" versus "formulation complexity" works. "Innovative" versus "traditional" does not, because it's not something a customer weighs at checkout.
Good axis pairs by category: price vs. efficacy claims (supplements), price vs. design minimalism (home goods), price vs. ingredient purity (skincare). Test your axis choice by asking whether a customer could point to a specific product attribute and place it on that line — if they can't, the axis is too abstract.
Common mistake: choosing two axes that correlate with each other (price and premium ingredients often move together), which collapses the map into a single diagonal line instead of four usable quadrants.
3. Score every competitor on both axes using real data
Assign each competitor a numeric score, 1-10, on each axis, backed by something concrete: actual shelf price, ingredient list length, review sentiment count, or ad spend visibility from a tool like Meta's Ad Library. Do not eyeball this from memory.
Cross-check your own scores against a second team member's independent scoring before finalizing — disagreement of more than 2 points on any axis usually means the axis definition is still too fuzzy. This step alone takes most of your 3-4 hour window, and that's expected.
Common mistake: scoring your own brand more favorably than the data supports. Positioning maps built to flatter the internal team are useless the moment they hit a media buyer's desk.
4. Plot the map and look for clusters, not just gaps
Plot every brand as a dot on the two-axis grid. You'll typically see 2-3 tight clusters where most competitors bunch up, fighting over the same customer with nearly identical claims — that clustering is itself a finding, not just a backdrop.
The empty quadrants matter, but only if they're reachable. A gap in the "ultra-premium, minimal formulation" corner is worthless if your supply chain can't support premium pricing. Rate each open space on feasibility before getting excited about it.
Common mistake: treating every white space as an opportunity. Some gaps are empty because nobody wants to be there — test demand signals (search volume, review requests, forum complaints) before committing.
5. Validate the map against customer language
Pull 20-30 reviews per competitor and tag recurring phrases — "too harsh," "finally something that works," "wish it was cheaper." These phrases should line up with where you plotted the brand; if they don't, your axis scoring is off, not the customer sentiment.
This step is what separates a map that holds up in a creative brief from one that gets challenged in the first stakeholder review. Customer research at this stage should confirm or correct your quantitative scoring, not replace it.
Common mistake: cherry-picking reviews that confirm the map you already drew instead of pulling a random sample.
6. Write the one-line positioning claim the map supports
Once the map is validated, write a single sentence naming the quadrant you occupy and why it's defensible: the only category brand that delivers a specific attribute without a specific tradeoff. This sentence should be checkable against the map itself — if a stakeholder can't point to your dot and confirm the claim, rewrite it.
This is also the point to run the finding by identifying your brand's competitive differentiator as a second pass, since the map and the differentiator statement should reinforce each other, not contradict.
Common mistake: writing a positioning claim so broad it could apply to three other brands on the same map.
7. Set a review cadence, because the map decays
Competitors reposition, launch new SKUs, and shift ad spend every quarter, which means a positioning map built in Q1 2026 can be stale by Q3 2026 without anyone noticing. Set a recurring 90-day check to re-score at least the three closest competitors.
Skipping this step is how brands end up running paid creative against a competitive landscape that no longer exists.
Troubleshooting
- The map looks like one big cluster with no white space: your axes are too correlated. Swap one axis for a less obvious attribute (packaging sustainability instead of price).
- Stakeholders disagree on where competitors sit: the scoring criteria weren't written down before plotting. Go back to step 3 and define the 1-10 scale in writing before rescoring.
- The identified white space doesn't convert in testing: the gap was empty because demand isn't there, not because competitors missed it. Validate with search or review data before building a campaign around it.
- The map was accurate at launch but feels wrong six months later: you skipped the 90-day review cadence in step 7. Competitors moved and the map didn't.
- Internal teams keep citing different competitor sets: there's no single owned document. Put the map in one shared file with an edit log, not a slide that gets copy-pasted into five different decks.
- The positioning claim doesn't test well with customers: it's likely too internal-facing (built from what the team believes) rather than data-backed (built from what reviews and pricing actually show).
Tools and resources
- Meta Ad Library for competitor creative and spend visibility
- Trustpilot, Amazon reviews, or category-specific retailer reviews for customer language
- A shared spreadsheet or Miro board for the scoring matrix and scatter plot
- Brand positioning statement structure for turning map findings into a written claim
- Brand positioning audit for checking whether current messaging still matches the map
What to do next
Once the map is drawn and validated, the next move is turning the white space into a positioning statement your creative team can brief against directly. Review how to write a brand positioning statement that wins customers to convert the map's findings into language your paid media and packaging teams can actually use.
One last thing
The most common failure Apex Brands sees when reviewing a client's existing positioning map isn't a bad axis choice — it's a map built once in 2024 or 2025 and never touched again while three new competitors entered the category. A positioning map with a 90-day review cadence attached to it, even a rough one, beats a polished map nobody revisits.
Questions we are
often asked.
The questions founders ask most often about this topic — answered straight.
Ask a question →01What's the best format for a brand positioning map?
02How many competitors should be on a positioning map?
03Is a positioning map the same as a perceptual map?
04How often should a positioning map be updated?
05Can a positioning map be built without competitor pricing data?
06Should the positioning map include indirect competitors?
07What's the difference between a positioning map and a brand audit?
08Does a positioning map help with paid media creative?
We work with a small number of brands each year.
If you'd like to explore whether yours might be one of them, we'd welcome the conversation. There is no deck, no SDR, and no obligation on either side.